Australia's leading independents had a tough battle for the top this year, with a new no.1 brokerage emerging
Australia's leading independents had a tough battle for the top this year, with a new no.1 brokerage emerging
This year’s MPA’s Top 10 Independent Brokerages report, sponsored by NAB Broker, was much more than just a list. Of course brokerage numbers, which we combined into a final score, reflected a great deal of hard work done by the brokers and support staff involved. But whilst many mortgage professionals work hard, these brokerages are clearly doing something differently.
Here you can find out who made this year’s list, and what they changed; clearly essential reading for anyone heading a brokerage, considering going independent, or simply looking to bridge that gap between broking and business excellence. You can read the full Top 10 Independent Brokerages report in MPA’s e-magazines section, coming soon.
Total loan book: $752,316,785
Total settlements 2013/14: $344,802,852
Number of brokers/loan writers: 9
Average annual volume per broker: $38,311,428
Conversion rate: 81%
Began in 2006 / Main client base in Sydney / Managing Director: Otto Dargan
"We’ve changed our business from thinking like a small business to thinking like a big business. Firstly that means promoting a lot of people. We had a flat management structure and all of our managers were spread too thin to do their job effectively. …we [also] hired a large number of experienced people as brokers. It’s much easier for us to hire now because good people often find us or have heard of us before."
Total loan book: $1,146,870,543
Total settlements 2013/14: $270,748,525
Number of brokers/loan writers: 15
Average annual volume per broker: $18,049,902
Conversion rate: 93%
Began in 2002 / Main client base in VIC/NSW/QLD / CEO: Daniel De Conza
"A year ago we had some key personal changes which made us take a closer look at our business. We looked at where our business came from, how we processed it and how we allocated funding. The review took a few months and we ended up with a business model that bought our clients, Credit Advisors and the business’ goals into alignment. With all parties working towards the same objective we have been able to make major changes to fundamental parts of our business without causing much disruption. This has delivered us improved productivity, a better working environment and more satisfied clients."
Total loan book: $1,146,870,543
Total settlements 2013/14: $270,748,525
Number of brokers/loan writers: 15
Average annual volume per broker: $18,049,902
Conversion rate: 93%
Began in 1996 / Main client base in Adelaide / Director: Steve Marshall
"We have employed two new brokers under a mentoring programme. Brokers have increased their marketing activities."
Total loan book: $ 1,000,000,000
Total settlements 2013/14: $ 457,000,000
Number of brokers/loan writers: 16
Average annual volume per broker: $ 28,562,500
Conversion rate: 72
Began in 1999 / Main client base in Perth / General Manager: Simon Kahl
"The WA construction market was accelerating last year so we quickly invested in recruiting a number of brokers and support staff to ensure that we were in a position to leverage off the increased business. There was a 2 month period late last year where we recruited 7 new staff. Over the last 2 years our team has also grown from 9 brokers to 19 brokers…We continue to invest time and effort into Broker Support to upskill our staff and constantly tweak and improve our process flows. We have also established a career path where new recruits wanting to become brokers will work in the support team for 12 months prior to becoming a Trainee Broker."
Total loan book: $ 1,600,000,000
Total settlements 2013/14: $ 607,000,000
Number of brokers/loan writers: 24
Average annual volume per broker: $ 25,291,667
Conversion rate: 54%
Began in 2002 / Main client base in NSW, ACT and QLD / General Manager: Alan Hemmings
"Working smarter not harder, with our focus remaining on productivity and recruitment."
Total loan book: $ 906,000,000
Total settlements 2013/14: $ 713,000,000
Number of brokers/loan writers: 13
Average annual volume per broker: $ 54,846,154
Conversion rate: 68
Began in 2005 / Main client base in Sydney / Senior Lending Manager: Roger Guo
"Customer focus, professional services and team hard work."
Total loan book: $ 933,651,126
Total settlements 2013/14: $ 216,726,592
Number of brokers/loan writers: 12
Average annual volume per broker: $ 18,060,549
Conversion rate: 95%
Began in 1998 / Client base in Perth / General Manager: Lisa Corlett
"We have streamlined our sales process to create a more uniform IMFS customer experience and also improved the efficiency of our back end processes to improve the overall experience for the client."
Total loan book: $ 1,145,265,000
Total settlements 2013/14: $388,792,615
Number of brokers/loan writers: 8
Average annual volume per broker: $48,599,077
Conversion rate: 95%
Began in 2003 / Main client base in NSW/QLD/VIC / Director: Jeremy Fisher
"Over the last year we have had a greater focus on financial planning as well as residential/commercial mortgage broking. With highly experienced in-house financial planners, we have been providing clients with a greater level of service and a more diligent duty of care. We have also had a stronger online presence – our website is consistently high-ranking on search engines and we have over 10,000 followers on social media such as Facebook, Twitter and LinkedIn. This year we have more brokers and staff than ever before, including a new post-settlement client liaison department to continue to service and guide clients after their loan settlement and beyond."
Total loan book: $ 1,673,333,373
Total settlements 2013/14: $ 407,367,528
Number of brokers/loan writers: 7
Average annual volume per broker: $ 58,195,361
Conversion rate: 99%
Began in 1995 / Main client base in ACT / Managing Director: Gerard Tiffen
"We haven’t changed much at all to be honest . We stand by our original beliefs and genuinely care for our clientele which contribute to the continued success of our company."
Total loan book: $ 1,318,055,924
Total settlements 2013/14: $ 537,618,577
Number of brokers/loan writers: 6
Average annual volume per broker: $ 89,603,096
Conversion rate: 92%
Began in 2009 / Main client base in Victoria / Managing Director: Jason Back
"With an increase in volume through an active client base in the market and referrals from both clients and business partners, we have focused strongly on both efficiency of process as well as the quality of our people, both which contribute heavily to the consistency of the client experience we wish to deliver. The focus on process de-risks the client from the challenges of what is an inefficient industry that is still fundamentally manual and labour intensive."
Congratulations to all our Top 10 on an excellent year - you can read the full Top 10 Independent Brokerages report in MPA's e-magazine, coming soon.
This year’s MPA’s Top 10 Independent Brokerages report, sponsored by NAB Broker, was much more than just a list. Of course brokerage numbers, which we combined into a final score, reflected a great deal of hard work done by the brokers and support staff involved. But whilst many mortgage professionals work hard, these brokerages are clearly doing something differently.
Here you can find out who made this year’s list, and what they changed; clearly essential reading for anyone heading a brokerage, considering going independent, or simply looking to bridge that gap between broking and business excellence. You can read the full Top 10 Independent Brokerages report in MPA’s e-magazines section, coming soon.
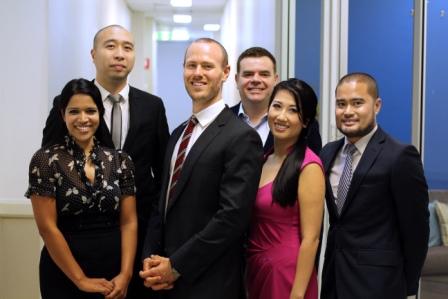 Joint 9th: Home Loan Experts
Total loan book: $752,316,785Total settlements 2013/14: $344,802,852
Number of brokers/loan writers: 9
Average annual volume per broker: $38,311,428
Conversion rate: 81%
Began in 2006 / Main client base in Sydney / Managing Director: Otto Dargan
"We’ve changed our business from thinking like a small business to thinking like a big business. Firstly that means promoting a lot of people. We had a flat management structure and all of our managers were spread too thin to do their job effectively. …we [also] hired a large number of experienced people as brokers. It’s much easier for us to hire now because good people often find us or have heard of us before."
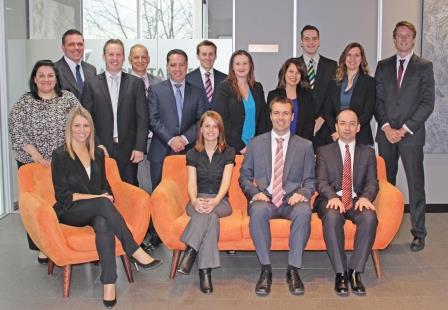 Joint 9th: Acceptance Finance
Total loan book: $1,146,870,543Total settlements 2013/14: $270,748,525
Number of brokers/loan writers: 15
Average annual volume per broker: $18,049,902
Conversion rate: 93%
Began in 2002 / Main client base in VIC/NSW/QLD / CEO: Daniel De Conza
"A year ago we had some key personal changes which made us take a closer look at our business. We looked at where our business came from, how we processed it and how we allocated funding. The review took a few months and we ended up with a business model that bought our clients, Credit Advisors and the business’ goals into alignment. With all parties working towards the same objective we have been able to make major changes to fundamental parts of our business without causing much disruption. This has delivered us improved productivity, a better working environment and more satisfied clients."
 8: The Loan Arranger
Total loan book: $1,146,870,543Total settlements 2013/14: $270,748,525
Number of brokers/loan writers: 15
Average annual volume per broker: $18,049,902
Conversion rate: 93%
Began in 1996 / Main client base in Adelaide / Director: Steve Marshall
"We have employed two new brokers under a mentoring programme. Brokers have increased their marketing activities."
 7: The Loan Company
Total loan book: $ 1,000,000,000Total settlements 2013/14: $ 457,000,000
Number of brokers/loan writers: 16
Average annual volume per broker: $ 28,562,500
Conversion rate: 72
Began in 1999 / Main client base in Perth / General Manager: Simon Kahl
"The WA construction market was accelerating last year so we quickly invested in recruiting a number of brokers and support staff to ensure that we were in a position to leverage off the increased business. There was a 2 month period late last year where we recruited 7 new staff. Over the last 2 years our team has also grown from 9 brokers to 19 brokers…We continue to invest time and effort into Broker Support to upskill our staff and constantly tweak and improve our process flows. We have also established a career path where new recruits wanting to become brokers will work in the support team for 12 months prior to becoming a Trainee Broker."
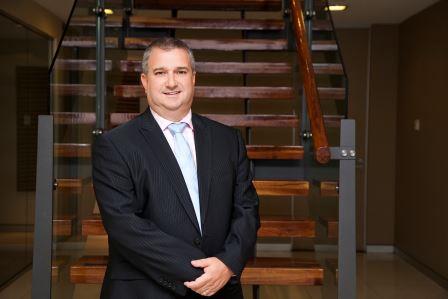 6: Oxygen Home Loans
Total loan book: $ 1,600,000,000Total settlements 2013/14: $ 607,000,000
Number of brokers/loan writers: 24
Average annual volume per broker: $ 25,291,667
Conversion rate: 54%
Began in 2002 / Main client base in NSW, ACT and QLD / General Manager: Alan Hemmings
"Working smarter not harder, with our focus remaining on productivity and recruitment."
 Joint: 4th: Apple Home Loan
Total loan book: $ 906,000,000Total settlements 2013/14: $ 713,000,000
Number of brokers/loan writers: 13
Average annual volume per broker: $ 54,846,154
Conversion rate: 68
Began in 2005 / Main client base in Sydney / Senior Lending Manager: Roger Guo
"Customer focus, professional services and team hard work."
 Joint 4th: In Mortgage and Finance Services
Total loan book: $ 933,651,126Total settlements 2013/14: $ 216,726,592
Number of brokers/loan writers: 12
Average annual volume per broker: $ 18,060,549
Conversion rate: 95%
Began in 1998 / Client base in Perth / General Manager: Lisa Corlett
"We have streamlined our sales process to create a more uniform IMFS customer experience and also improved the efficiency of our back end processes to improve the overall experience for the client."
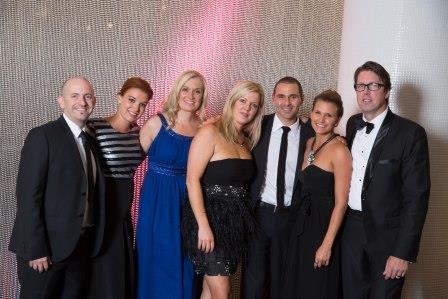 3rd: 1st Street Home Loans
Total loan book: $ 1,145,265,000Total settlements 2013/14: $388,792,615
Number of brokers/loan writers: 8
Average annual volume per broker: $48,599,077
Conversion rate: 95%
Began in 2003 / Main client base in NSW/QLD/VIC / Director: Jeremy Fisher
"Over the last year we have had a greater focus on financial planning as well as residential/commercial mortgage broking. With highly experienced in-house financial planners, we have been providing clients with a greater level of service and a more diligent duty of care. We have also had a stronger online presence – our website is consistently high-ranking on search engines and we have over 10,000 followers on social media such as Facebook, Twitter and LinkedIn. This year we have more brokers and staff than ever before, including a new post-settlement client liaison department to continue to service and guide clients after their loan settlement and beyond."
 2. Tiffen and Co.
Total loan book: $ 1,673,333,373Total settlements 2013/14: $ 407,367,528
Number of brokers/loan writers: 7
Average annual volume per broker: $ 58,195,361
Conversion rate: 99%
Began in 1995 / Main client base in ACT / Managing Director: Gerard Tiffen
"We haven’t changed much at all to be honest . We stand by our original beliefs and genuinely care for our clientele which contribute to the continued success of our company."
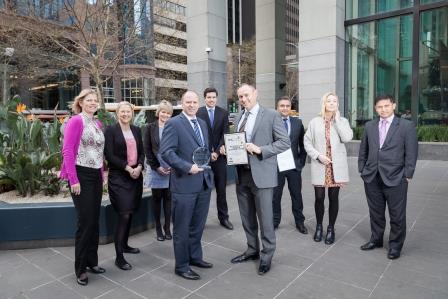 1. The Australian Lending and Investment Centre
Total loan book: $ 1,318,055,924Total settlements 2013/14: $ 537,618,577
Number of brokers/loan writers: 6
Average annual volume per broker: $ 89,603,096
Conversion rate: 92%
Began in 2009 / Main client base in Victoria / Managing Director: Jason Back
"With an increase in volume through an active client base in the market and referrals from both clients and business partners, we have focused strongly on both efficiency of process as well as the quality of our people, both which contribute heavily to the consistency of the client experience we wish to deliver. The focus on process de-risks the client from the challenges of what is an inefficient industry that is still fundamentally manual and labour intensive."
Congratulations to all our Top 10 on an excellent year - you can read the full Top 10 Independent Brokerages report in MPA's e-magazine, coming soon.


