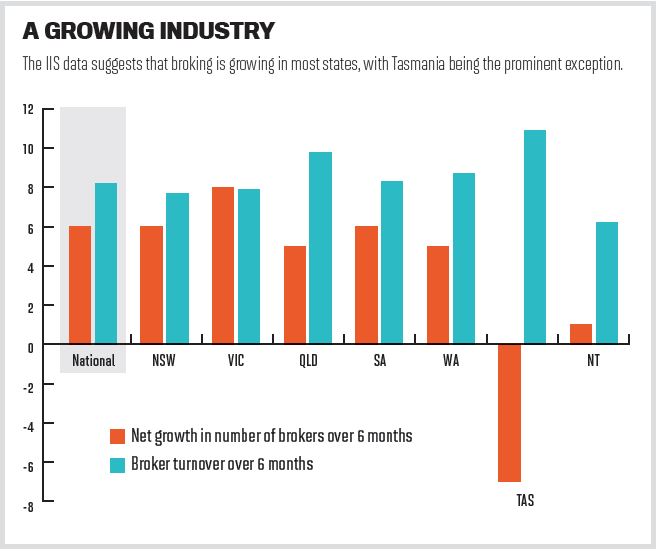
Brokers have always wondered where they stand in comparison to their peers, and a new report by the MFAA could finally give them the answer
A new MFAA report on brokers is almost the dictionary definition of ‘a long time coming’. Over recent years the lack of concrete data on the broking sector as a whole has become almost absurd in what claims to be a fully professionalised industry.
Without basic data – like the number of brokers, the amount they earn and the value of loans they write – dubious claims about brokers have been allowed to flourish, both within the industry and among sceptical outsiders.
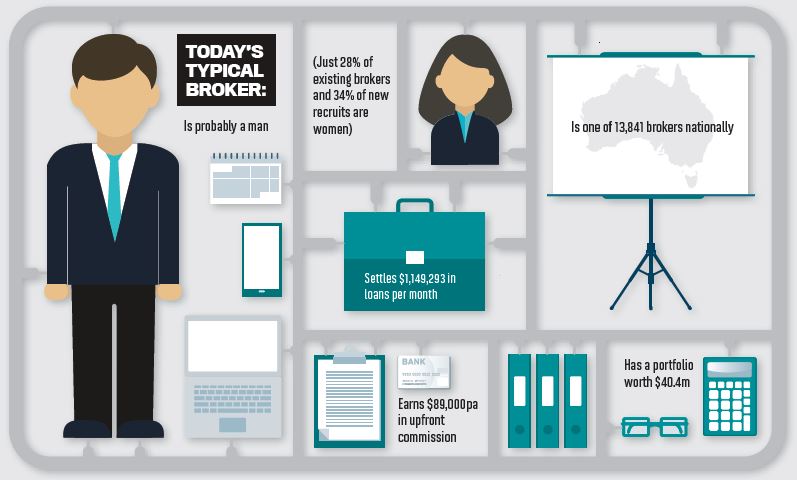
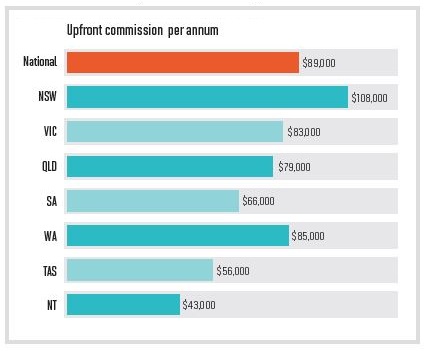
Essentially, the MFAA Industry Intelligence Service (IIS) report is a response to two trends: firstly, the move towards benchmarking, as an increasing number of aggregators allow brokers to compare their numbers with those of their peers; and secondly, this data is also important to the MFAA as it looks to engage with regulators and the mainstream press. With a review of broker remuneration on the way, having a figure for the average broker’s upfront commission ($89,000 per annum) will be particularly useful for the industry.
Most importantly, however, the IIS report is a wake-up call for those brokers who are falling behind. Having state-specific figures for commission is especially valuable, given the huge price differences between Sydney, Melbourne and the rest of the country.
There are other useful findings in the report, such as figures on average portfolio size and average value of settled loans per month.
Finally, the continuing predominance of men in the industry (72% of existing brokers and 66% of new recruits) raises questions over how industry associations and brokerages can attract more women into the industry.
LIMITATIONS OF THE REPORT
What makes the MFAA’s Industry Intelligence Service (IIS) data particularly valuable is that it doesn’t just include MFAA members; it also draws data from 16 aggregators. The MFAA claims the study therefore represents 90% of the industry (although the FBAA has publicly disputed this figure). Whether or not the IIS represents the entire marketplace, with 13,841 brokers represented, this survey is large enough to be representative.
If there are limitations, they come from the time period to which this survey refers – just six months between March and September 2015. However, as the IIS plans to publish reports twice a year, this shouldn’t be a major problem.
Finally, the data related to commercial lending is held back by a lower response rate from the industry: 60% of respondents reported their commercial loan values to the MFAA.
 WHAT’S IN YOUR WALLET?
While Sydney and Melbourne compete for the title of Australia’s hottest (and, some say, most overpriced) housing markets, it seems NSW brokers are comfortably ahead when it comes to upfront commission earnings.

THE GROWING BROKER DIVIDE
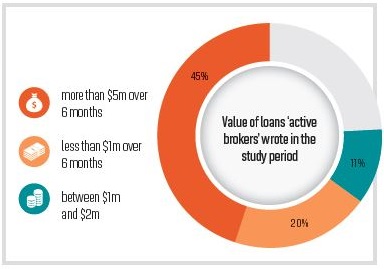
One particularly interesting finding of the IIS relates to the value of loans ‘active brokers’ wrote in the study period: 45% of brokers originated more than $5m over the six months, while 20% originated less than $1m over the same period, with another 11% writing between $1m and $2m. While these statistics are intended to categorise brokers into high and low performers, they also raise the question why the sub-$1m group is so large. It’s possible that within this group a number of established brokers write few new loans but receive substantial amounts of trail income, or that despite the NCCP a number of part-time brokers still remain in the industry.

Without basic data – like the number of brokers, the amount they earn and the value of loans they write – dubious claims about brokers have been allowed to flourish, both within the industry and among sceptical outsiders.
Essentially, the MFAA Industry Intelligence Service (IIS) report is a response to two trends: firstly, the move towards benchmarking, as an increasing number of aggregators allow brokers to compare their numbers with those of their peers; and secondly, this data is also important to the MFAA as it looks to engage with regulators and the mainstream press. With a review of broker remuneration on the way, having a figure for the average broker’s upfront commission ($89,000 per annum) will be particularly useful for the industry.

Most importantly, however, the IIS report is a wake-up call for those brokers who are falling behind. Having state-specific figures for commission is especially valuable, given the huge price differences between Sydney, Melbourne and the rest of the country.
There are other useful findings in the report, such as figures on average portfolio size and average value of settled loans per month.
Finally, the continuing predominance of men in the industry (72% of existing brokers and 66% of new recruits) raises questions over how industry associations and brokerages can attract more women into the industry.
LIMITATIONS OF THE REPORT
What makes the MFAA’s Industry Intelligence Service (IIS) data particularly valuable is that it doesn’t just include MFAA members; it also draws data from 16 aggregators. The MFAA claims the study therefore represents 90% of the industry (although the FBAA has publicly disputed this figure). Whether or not the IIS represents the entire marketplace, with 13,841 brokers represented, this survey is large enough to be representative.
If there are limitations, they come from the time period to which this survey refers – just six months between March and September 2015. However, as the IIS plans to publish reports twice a year, this shouldn’t be a major problem.
Finally, the data related to commercial lending is held back by a lower response rate from the industry: 60% of respondents reported their commercial loan values to the MFAA.
 WHAT’S IN YOUR WALLET?
 While Sydney and Melbourne compete for the title of Australia’s hottest (and, some say, most overpriced) housing markets, it seems NSW brokers are comfortably ahead when it comes to upfront commission earnings.

THE GROWING BROKER DIVIDE
One particularly interesting finding of the IIS relates to the value of loans ‘active brokers’ wrote in the study period: 45% of brokers originated more than $5m over the six months, while 20% originated less than $1m over the same period, with another 11% writing between $1m and $2m. While these statistics are intended to categorise brokers into high and low performers, they also raise the question why the sub-$1m group is so large. It’s possible that within this group a number of established brokers write few new loans but receive substantial amounts of trail income, or that despite the NCCP a number of part-time brokers still remain in the industry.


