July NZ Property Report reveals the latest trends

Reductions in mortgage interest rates, declining inflation, and speculation about the official cash rate dropping sooner than previously anticipated may be fostering midwinter economic optimism.
Despite this, the latest data from realestate.co.nz indicates that the property market has yet to heat up, characterised by ample choices and slow sales during the 2024 winter season.
The insights come from realestate.co.nz’s latest NZ Property Report, which reveals the latest trends across the motu.
Housing stock ‘unusually high’
Total stock increased during July by 32.3% year-on-year to 30,556 properties for sale.
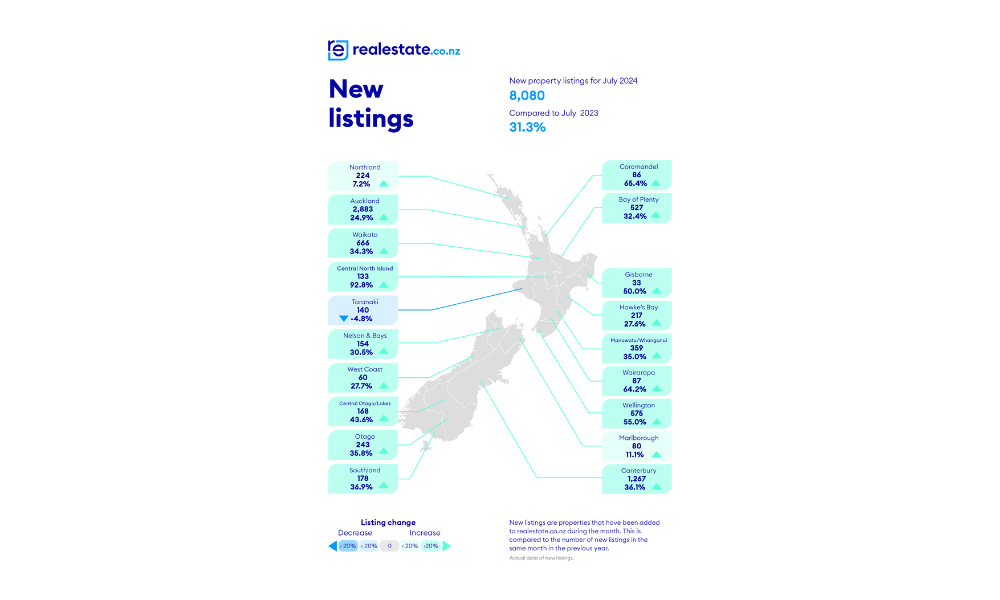
New listings were also unseasonably high, up 31.3% year-on-year, breaking a seven-year trend of low listing levels in July. Adding to the property market’s winter chill, 10 of our 19 regions experienced a slower-than-average rate of sale last month.
Sarah Wood (pictured above), CEO of realestate.co.nz, said that supply was unusually high for July, with almost 7,500 more total homes for sale than this time last year:
“Seventeen of our 19 regions saw double-digit growth to total stock levels compared to July 2023, with just Taranaki and West Coast slightly behind at 6.6% and 8.7%, respectively,” Wood said.
“Buyers have ample choice and time to decide, but this will be a competitive market for many sellers. They should research local market trends and be prepared to negotiate to meet the market.”
Average asking prices experienced regional fluctuations in July, diverging from the relative stability observed in most regions over the past 18 months.
The findings echo Real Estate Institute of New Zealand (REINZ) June data, which indicated a decline in sales and median prices across the nation, while listings continue to increase.
The total number of properties sold in New Zealand dropped by 25.6% year-on-year, from 5,854 to 4,356, and by 32.6% compared to May 2024, from 6,461 to 4,356.
Wood said that while it was too early to say if these changes signalled a market shift, consumer confidence and interest rate adjustments are likely to be key drivers of future market trends.
Display price remains the most popular method of sale across the real estate website’s listings, followed by negotiation.
“This again indicates that people are taking their time to transact, reflecting the slower pace of the market,” Wood said.
Vendors busier than usual this winter
Breaking a seven-year trend of low listings during July, new listings were up 31.3% nationally last month. This growth was reflected in all regions except Taranaki, where new listings dropped by 4.8% compared to July 2023.
However, Taranaki’s smaller market size means this was a drop of just seven listings.
The biggest increase was in Central North Island, where new listings nearly doubled, increasing by 92.8% from 69 in July 2023 to 133 in July 2024.
“In this economic climate, some property owners will be forced to sell. Particularly if they bought at the peak of the market when interest rates were low,” Wood said.
She noted that several economic factors, including recent policy shake-ups, have influenced the market.
“We’ve seen a spate of changes, such as the shortening of the bright-line test from 10 years to two years, effective July 1. This change allows investors to sell sooner without incurring capital gains tax.”
“While it is too early to attribute the rise in listings to this change, we understand that many investors were geared up to list their properties on or after July 1.”
Slower than average rate of sale in 10 of 19 regions
Vendors might have been busy listing their properties and tidying up for weekend open homes, but buyers took their time last month. 10 of our 19 regions saw a slower-than-usual rate of sale in July.
Rate of sale measures how long it would take, theoretically, to sell the current stock at current average rates of sale if no new properties were to be listed for sale.
For example, in Auckland, realestate.co.nz calculations show that it would currently take 40 weeks for all stock to be sold, compared to the long-term average of 23 weeks. Auckland saw the biggest slowdown in its rate of sale of all regions during July.
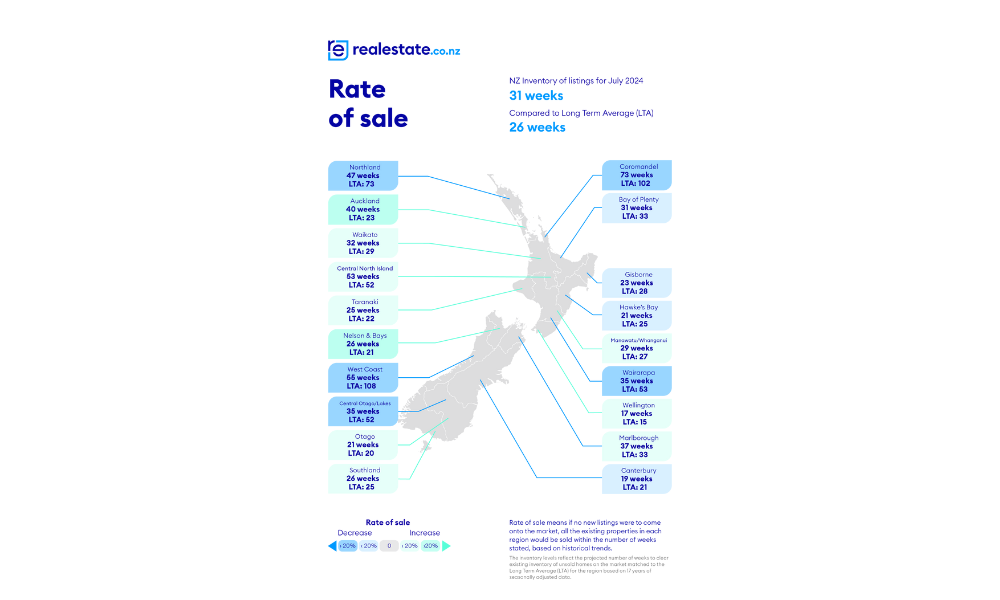
Our analysis draws on 17 years of comprehensive property data to ensure accurate insights.
“The high stock levels we have seen throughout 2024, combined with slower sales, could provide opportunities for buyers. However, this depends on individual circumstances,” Wood said.
Wood also noted that high interest rates and new debt-to-income ratios (DTIs) could impact their ability to purchase.
“For sellers, understanding current market conditions is crucial. Staying informed, getting advice from your local agent and being flexible can make a significant difference in navigating this slower market,” Wood said.
Average asking price fluctuations across the motu
In July, average asking prices varied across the country. Canterbury, Central Otago/Lakes District, Coromandel, Gisborne, Marlborough, and Otago saw average asking prices grow month-on-month and year-on-year.
In contrast, Central North Island, Hawkes Bay, Nelson, Northland, Waikato, and West Coast saw average asking prices decrease month-on-month and year-on-year.
This coincided with Tony Alexander’s analysis that showed 50% of agents felt that prices were falling in their area in July.
“This result is close to those for all months since April and suggests that when the June data on real estate activity are released by REINZ we will see another nationwide average house price decline,” Alexander said.
Gisborne’s average asking price reached $710,960 in July, marking the first time it has been above $700,000 since March 2023. Northland, on the other hand, saw its average asking price decrease to $773,623 in July. This is the first time Northland’s average asking price has been below $800,000 since October 2021.
Wood said these fluctuations are notable as they differ from the more moderate rises and falls of around 5% that have typified the last 18 months:
“It remains to be seen if this signals the end of the 18-month average asking price stability we’ve seen around the country, but vendor expectations may be shifting in some regions.”
The national average asking price in July was down 2.3% year-on-year and 1.4% month-on-month to $848,548. For the last year and a half, the national average asking price has been relatively flat, fluctuating between about $860,000 and $890,000.