Index surpasses record for two months straight, but experts see signs of cooling market
US home prices slowed after nearly 10 months of accelerating annual gains, according to the S&P CoreLogic Case-Shiller National Home Price NSA Index.
The index, covering all nine census divisions, reported a 6.3% annual gain for April, slightly down from a 6.5% gain in March. The 10-city Composite saw an annual increase of 8%, while the 20-city Composite posted a 7.2% year-over-year increase.
CoreLogic chief economist Selma Hepp noted that “while the slowing of annual gains still largely reflects residual comparison with a strong 2023 spring season, the monthly gain in April, up 1.2%, buckled the seasonal trend, and slowed under the persistent pressure of high and rising mortgage rates, particularly earlier in the spring.”
 After seasonal adjustment, the National Index posted a month-over-month increase of 0.3%, the 10-City Composite rose 0.5%, and the 20-City reported a monthly increase of 0.4%.
Brian Luke, head of commodities, real and digital assets at S&P Dow Jones Indices, commented on the trend: “For the second consecutive month, we’ve seen our National Index jump at least 1% over its previous all-time high. 2024 is closely tracking the strong start observed last year, where March and April posted the largest rise seen prior to a slowdown in the summer and fall.
“Heading into summer, the market is at an all-time high, once again testing its resilience against the historically more active time of the year,” he said in the report.
Despite the overall growth, the pace of price increases has decelerated since the start of the year, with only two markets rising annually.
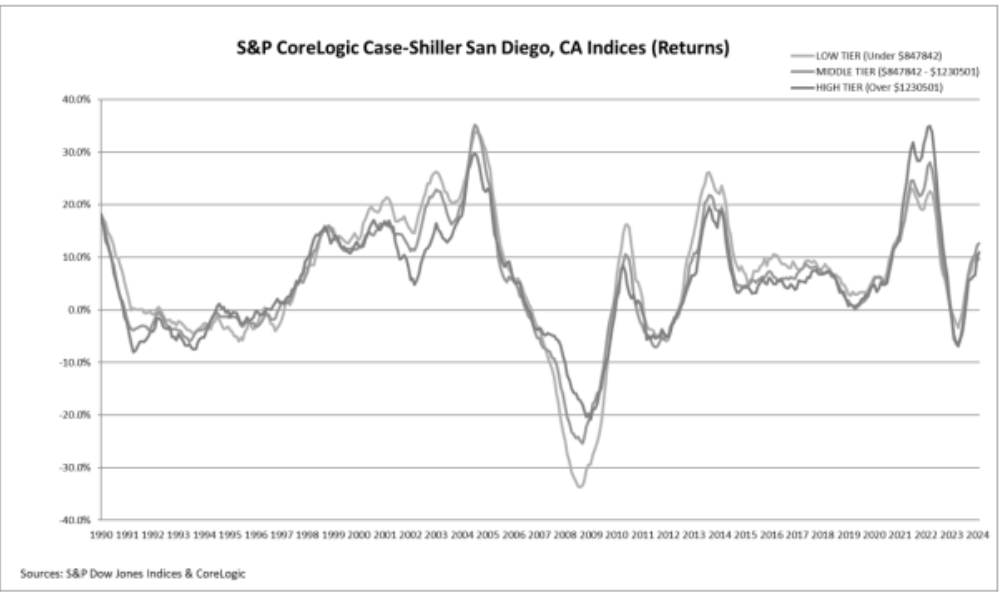
“Thirteen markets are currently at all-time highs, and San Diego reigns supreme once again, topping annual returns for the last six months,” Luke said. “The Northeast is the best-performing market for the previous nine months, with New York rising 9.4% annually. Sustained outperformance of the Northeast market was last observed in 2011. For the decade that followed, the West and the South held the top posts for performance. It’s now been over a year since we’ve seen the top region come from the South or the West.”
Read next: When will US interest rates fall?
“Nineteen of the 20 Case Shiller metro areas saw annual growth rate slow, except Las Vegas – where home price growth continued to heat up manifesting continued in-migrating demand from buyers from more-expensive Western markets,” Hepp added.
“Also, higher priced segments in markets with strong wages and elevated levels of accumulated home equity, such as Boston, San Francisco and Seattle, outperformed the other markets, as homebuyers in those markets had more leverage when making home purchases, but also continued lack of supply meant demand still outpaces supply putting pressure on prices.”
Stay updated with the freshest mortgage news. Get exclusive interviews, breaking news, and industry events in your inbox, and always be the first to know by subscribing to our FREE daily newsletter.